● Live monitoring for rivers, lakes, canals, pools, farms and plants

Water quality,
understood.

Send readings from any sensor. Aquasense scores every parameter against the right limits, explains what is happening in plain language, and tells you before it matters.

The first 500,000 units are free. No hardware needed to try it: upload a CSV or JSON file of past readings.

aq-platform.sensifai.com/dashboard
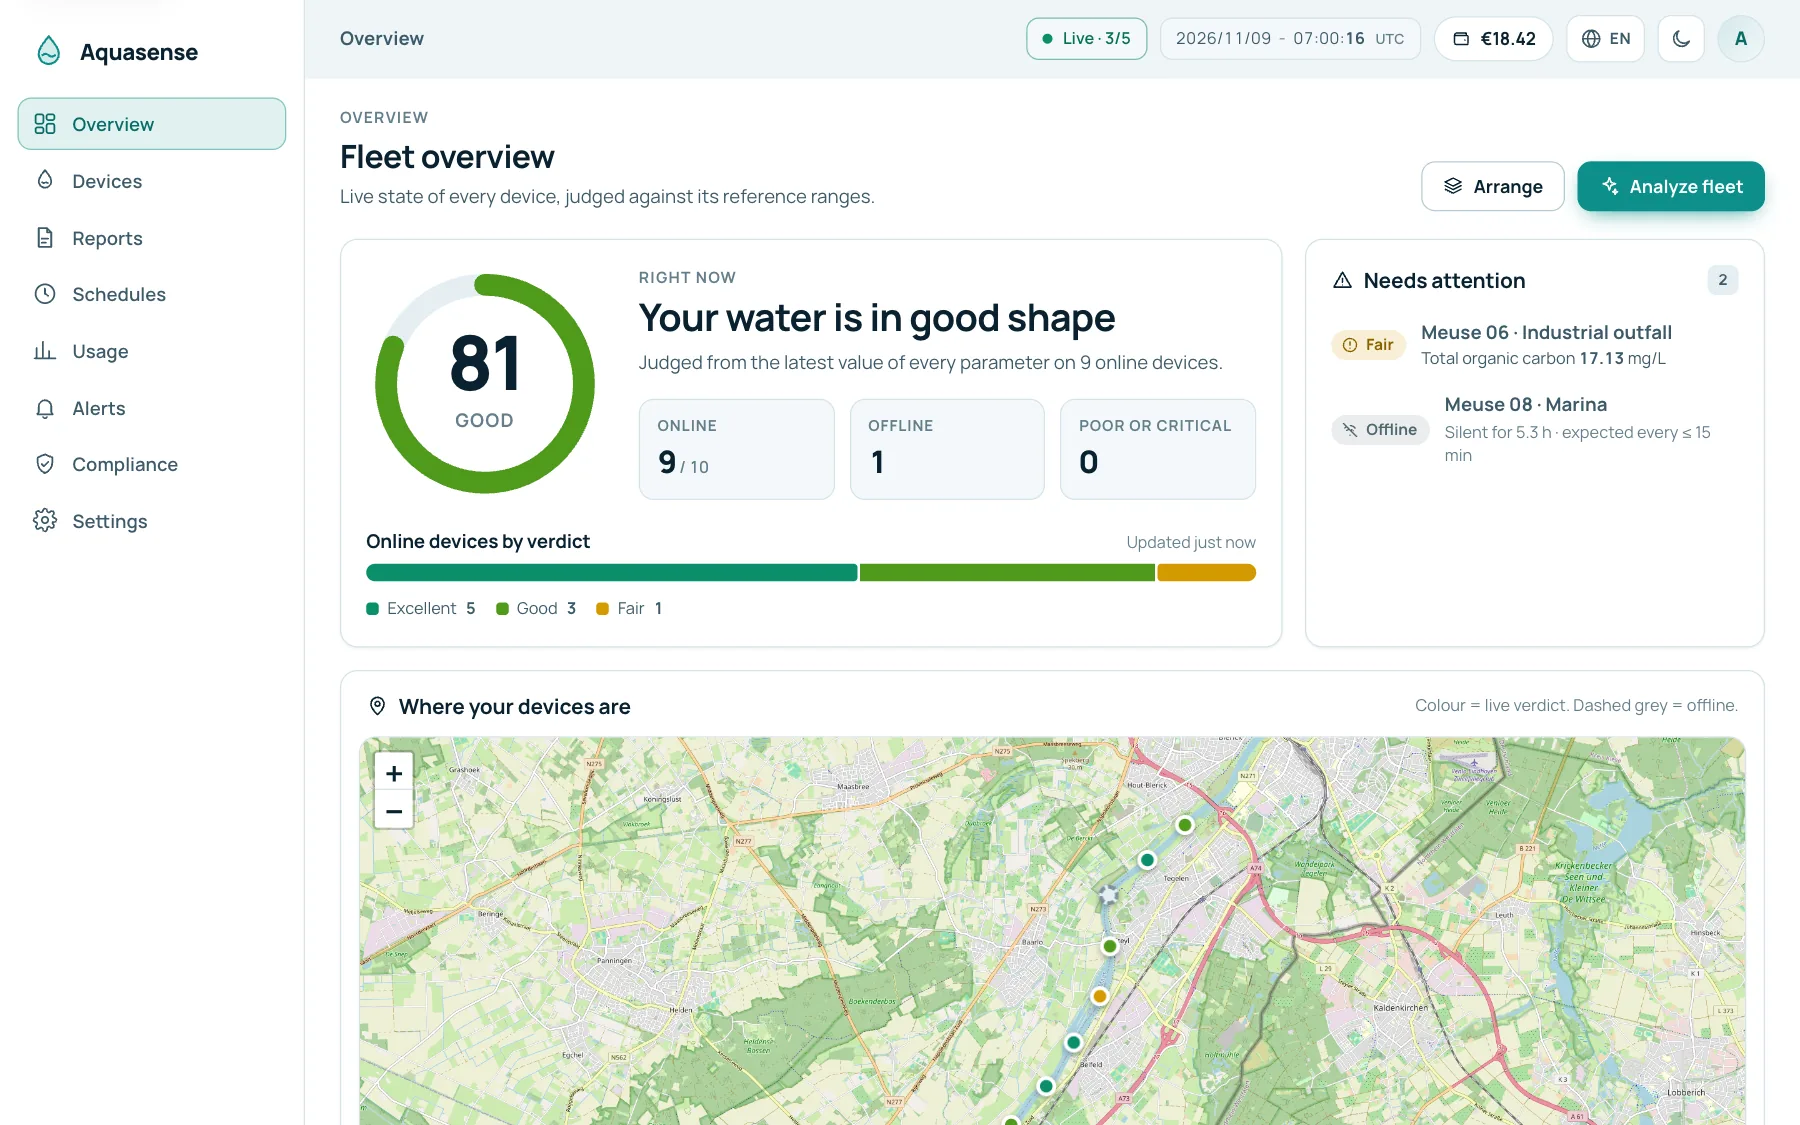
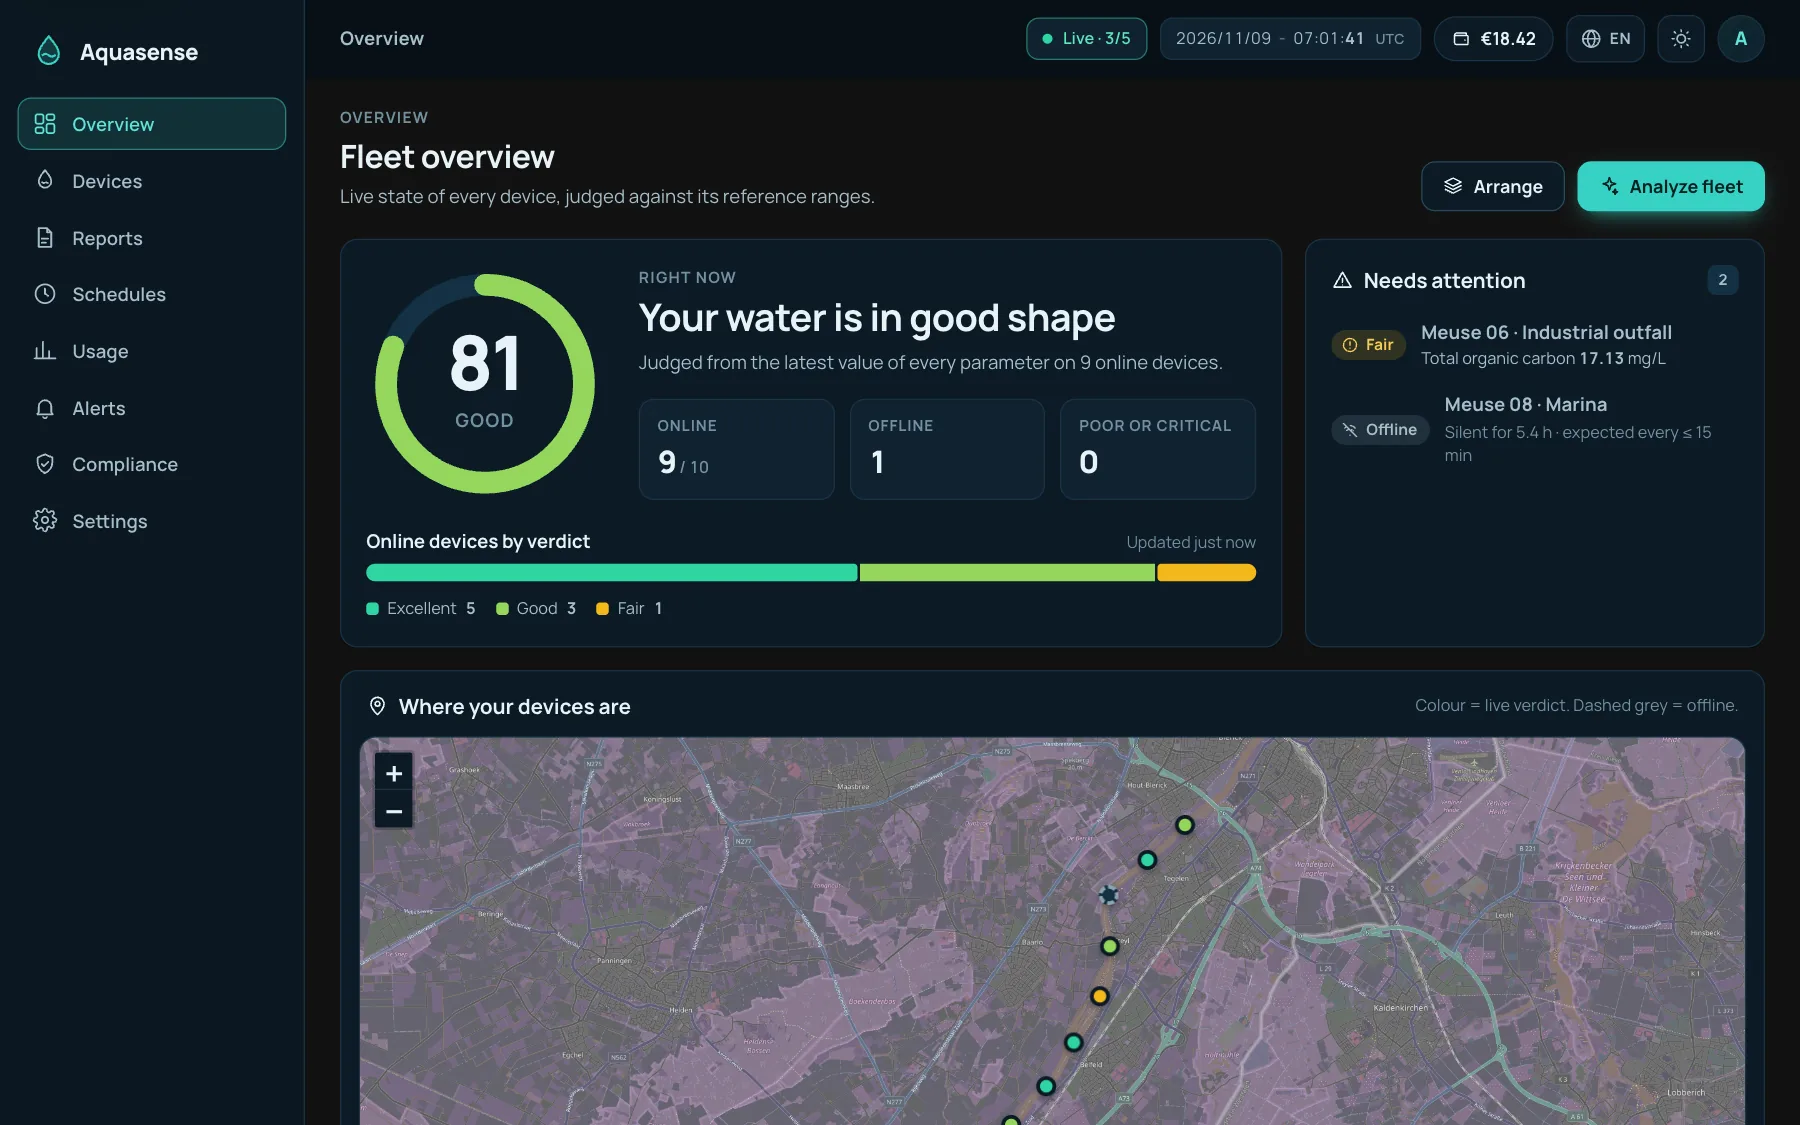
The Aquasense fleet overview in the light theme: a fleet score, devices needing attention and a map. The Aquasense fleet overview in the dark theme: a fleet score, devices needing attention and a map.
0parameters, from pH to phycocyanin
0water profiles, each with its own limits
0median to accept a report, in our load test
0reports per second on a single node
MQTTMQTT over WebSocketHTTPSLoRaWAN · TTN · ChirpStackModbus gatewayCSV / JSON import
How it works

From a probe in the water to a decision, in one place.

Scroll through the product. Click any screen to open it full size.

1

Connect any sensor in minutes.

Create a key for a device, point it at MQTT, HTTPS or your LoRaWAN network server, and readings start arriving. No SDK, no agent.

  • A device key can send for that one device and nothing else.
  • Name, location and water profile ride along on the first report.
  • No hardware yet? Upload a CSV or JSON file of past readings.
2

Your whole fleet, judged live.

Every device shows a score from 0 to 100, its worst parameters and when it last reported. Offline probes are called out instead of quietly going stale.

  • Scores are computed from reference ranges, not guessed.
  • Presence uses the server clock, so a wrong device clock cannot hide an outage.
  • Search, filter and sort by what needs attention.
3

One verdict you can read at a glance.

The overview rolls the fleet into a single score, a verdict bar and a short list of what needs attention right now.

  • Arrange the widgets the way your team works.
  • Live badge shows how many devices are reporting.
  • One click starts a fleet analysis.
4

See where the water is.

Every device with a position appears on the map, coloured by its live verdict. Group devices by plant, pond or building into sites.

  • Latitude and longitude are optional per device.
  • Offline devices show dashed grey.
  • The live chart below follows whichever device you pick.
5

Every parameter, against the right limits.

Charts draw the ideal, watch and critical bands for the device's water profile, so a number is never just a number. Raw events are one tab away for debugging.

  • Last hour to 30 days, or a custom range.
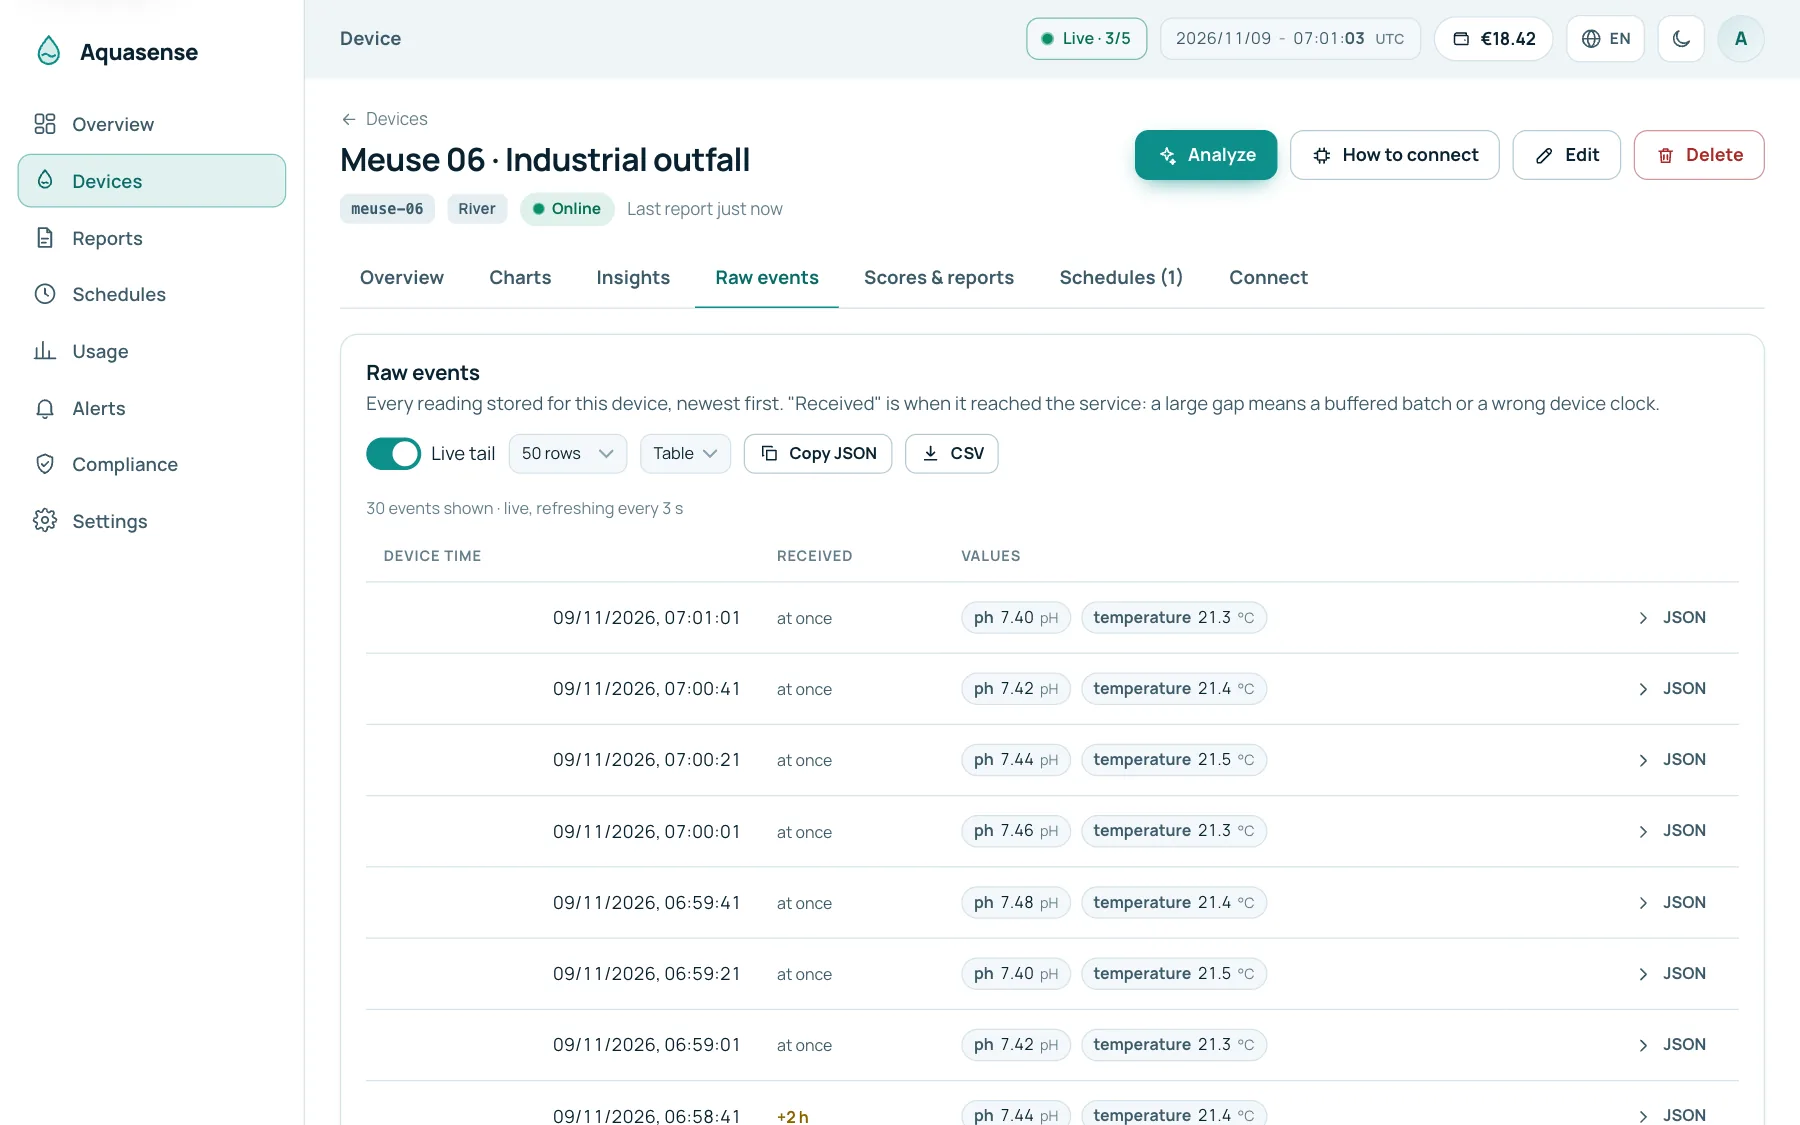
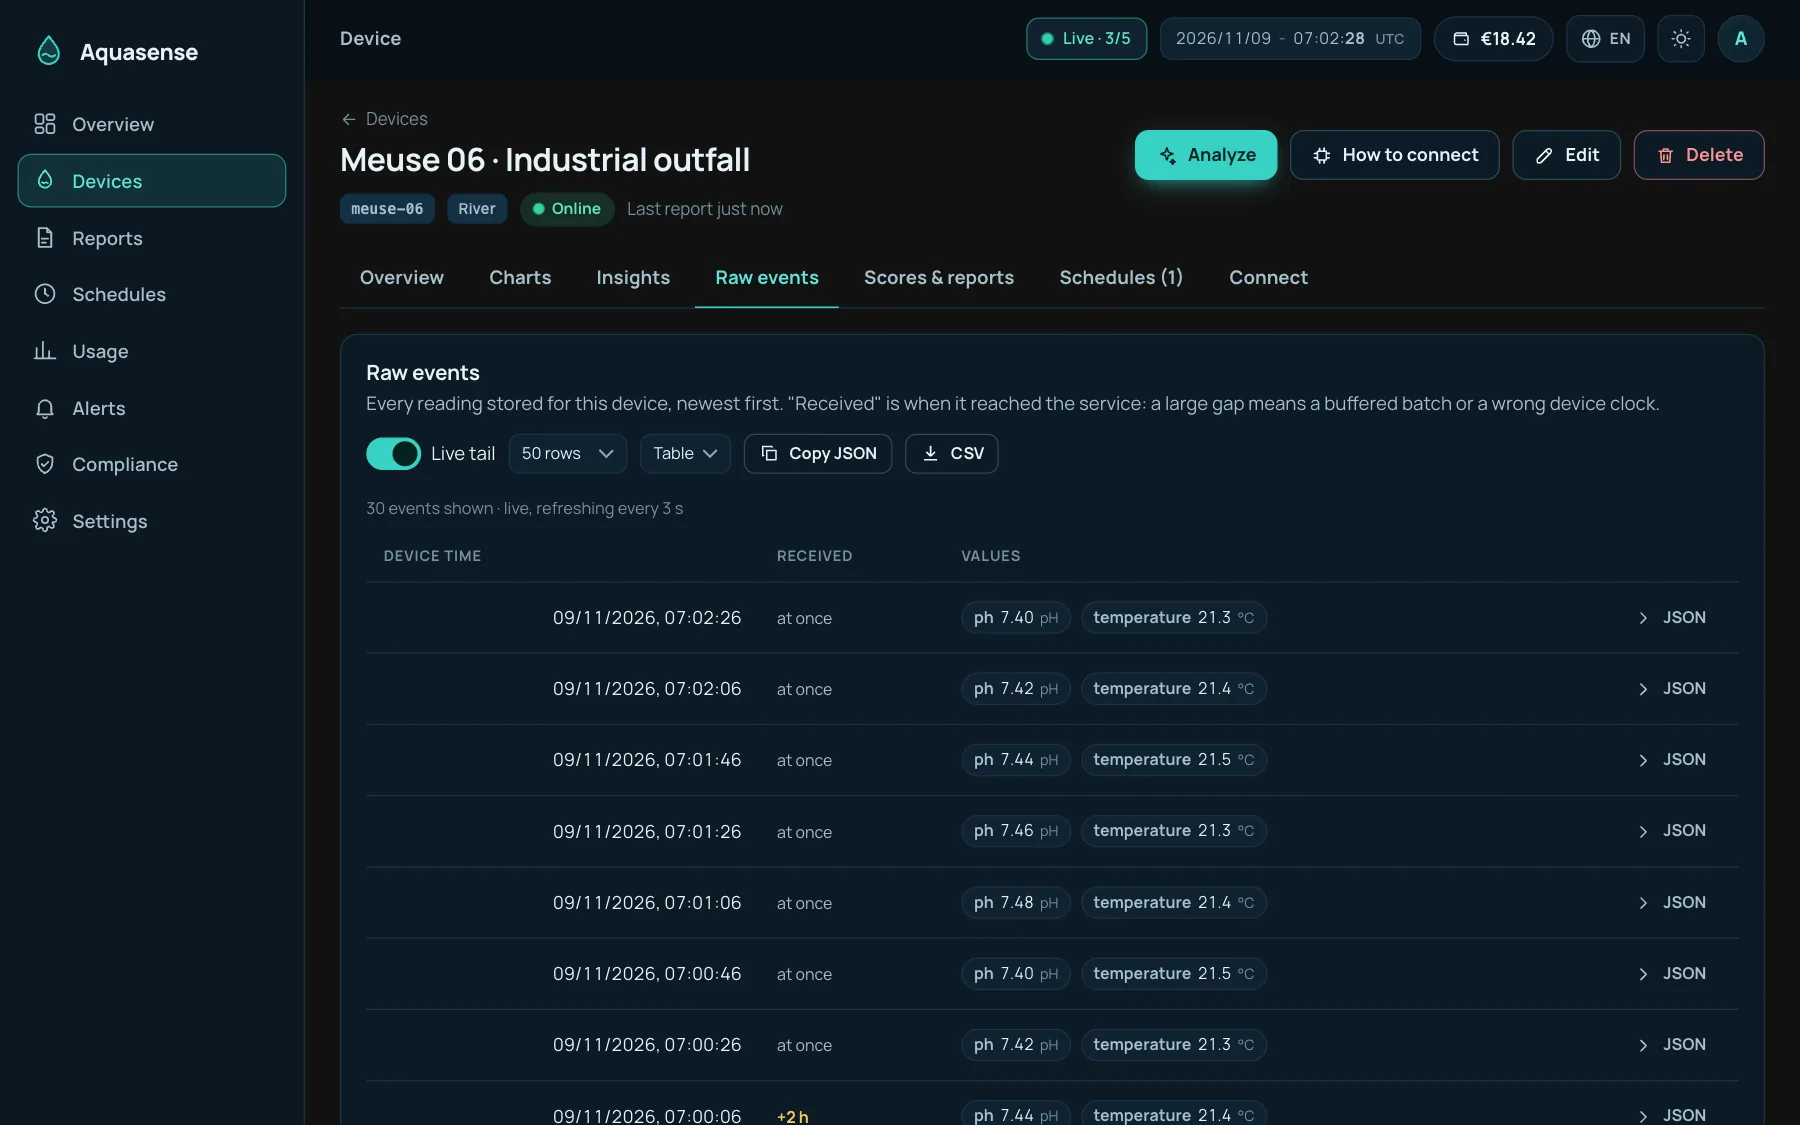
  • Raw events show what arrived, when, and how late.
  • Copy or download the JSON and CSV.
6

AI that explains, with the arithmetic done first.

Aquasense aggregates your readings in code, computes a baseline score, then asks the model to interpret trends, combinations and likely causes. It can nudge a score a little, never invent one.

  • The model sees aggregates, never raw readings.
  • A device with a location gets a short note on its surroundings.
  • Download as PDF, JSON or CSV.
7

Alerts that reach the right person.

Rules fire when a device goes quiet, a parameter leaves its range or an analysis comes back poor. Deliver by email, SMS, Telegram, Slack or a signed webhook.

  • Acknowledge, snooze and assign from one place.
  • Escalation and on-call windows.
  • History of everything that fired.
8

Show a regulator that the limits were met.

A monthly report with every exceedance, data completeness and calibration notes, built from your stored readings. Download the PDF and CSVs, or email it on a schedule.

  • Your own limits, instantaneous, daily or period mean.
  • Calibration log alongside the data.
  • Figures are computed, not generated.
9

Pay for what you use, and see it.

One tiny unit price, a generous free band and a clear rate card. The Billing page shows your wallet, what each thing costs and what you used in the last 30 days.

  • Analyses are billed by how much the AI reads and writes.
  • Failed or refused analyses cost nothing.
  • Charts, live state and presence are free.
aq-platform.sensifai.com
Device keyClick to enlarge
Everything around the data

The details that make it work for a real team.

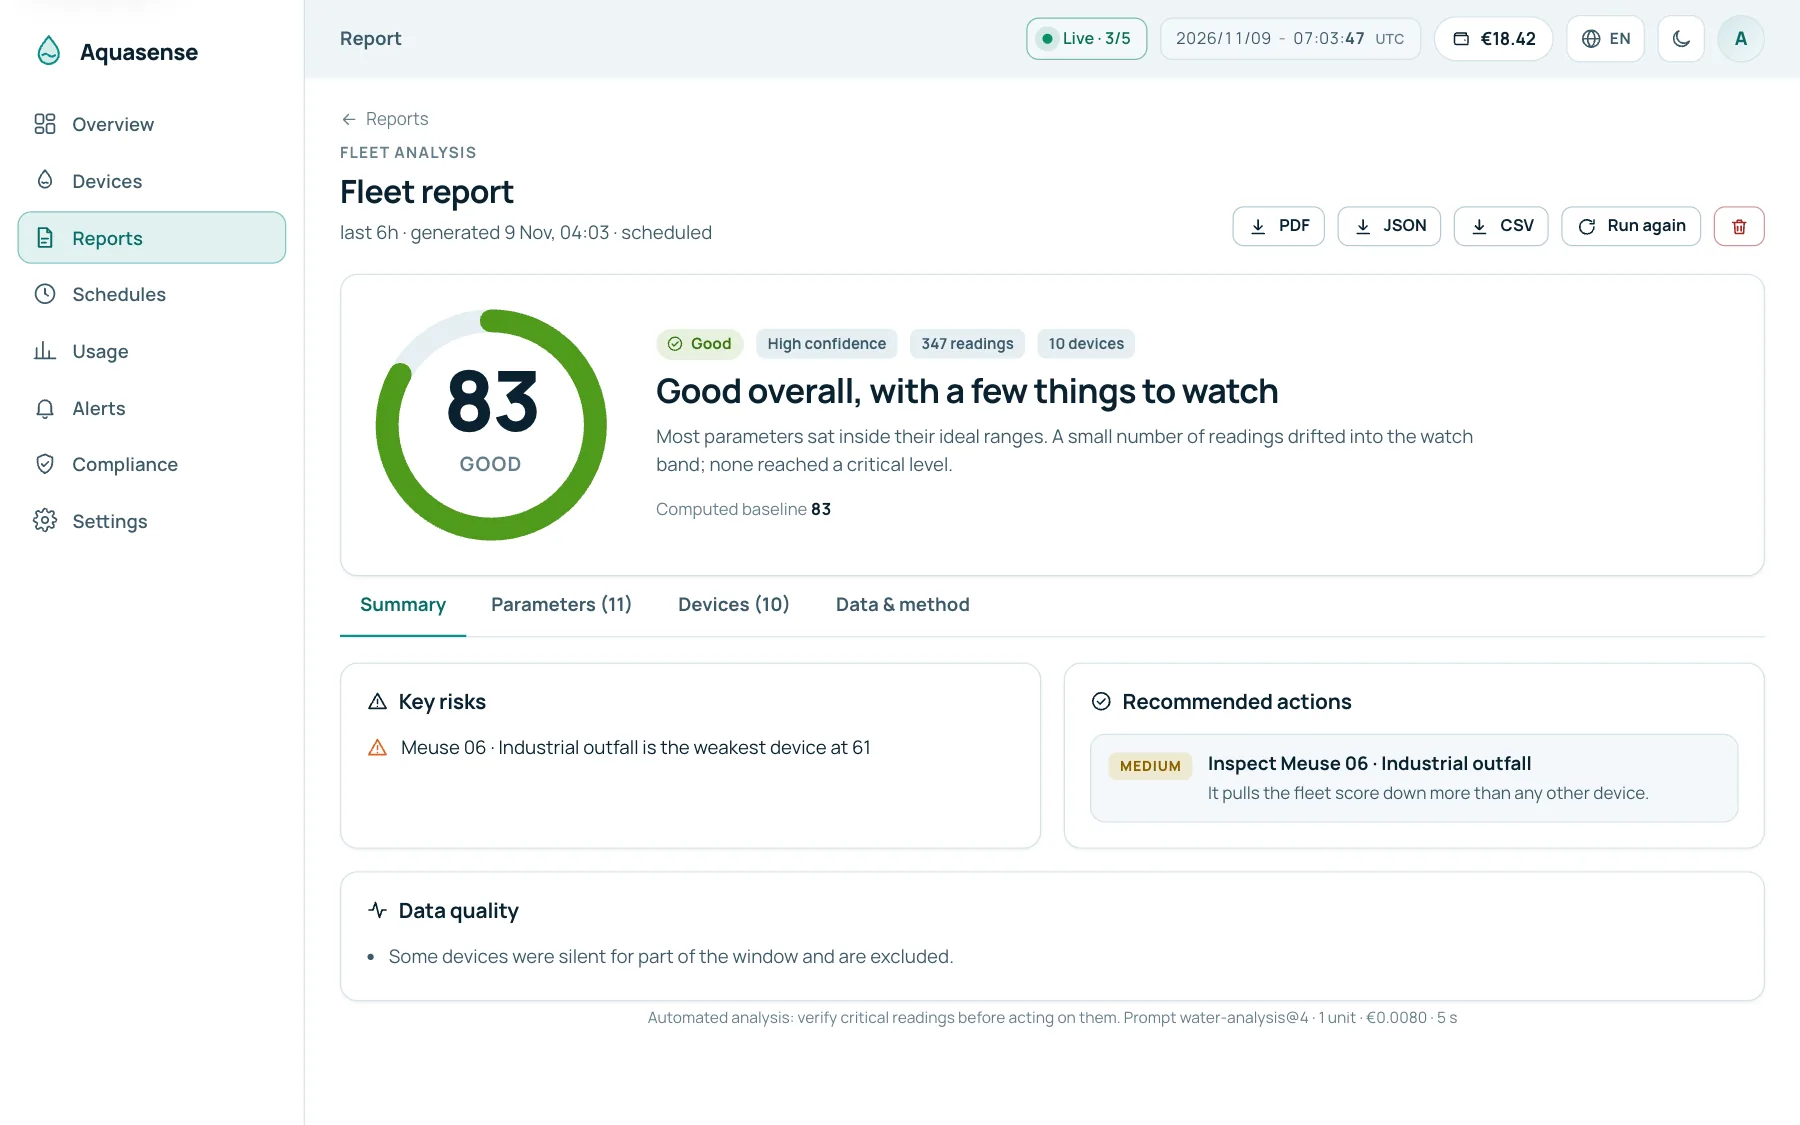
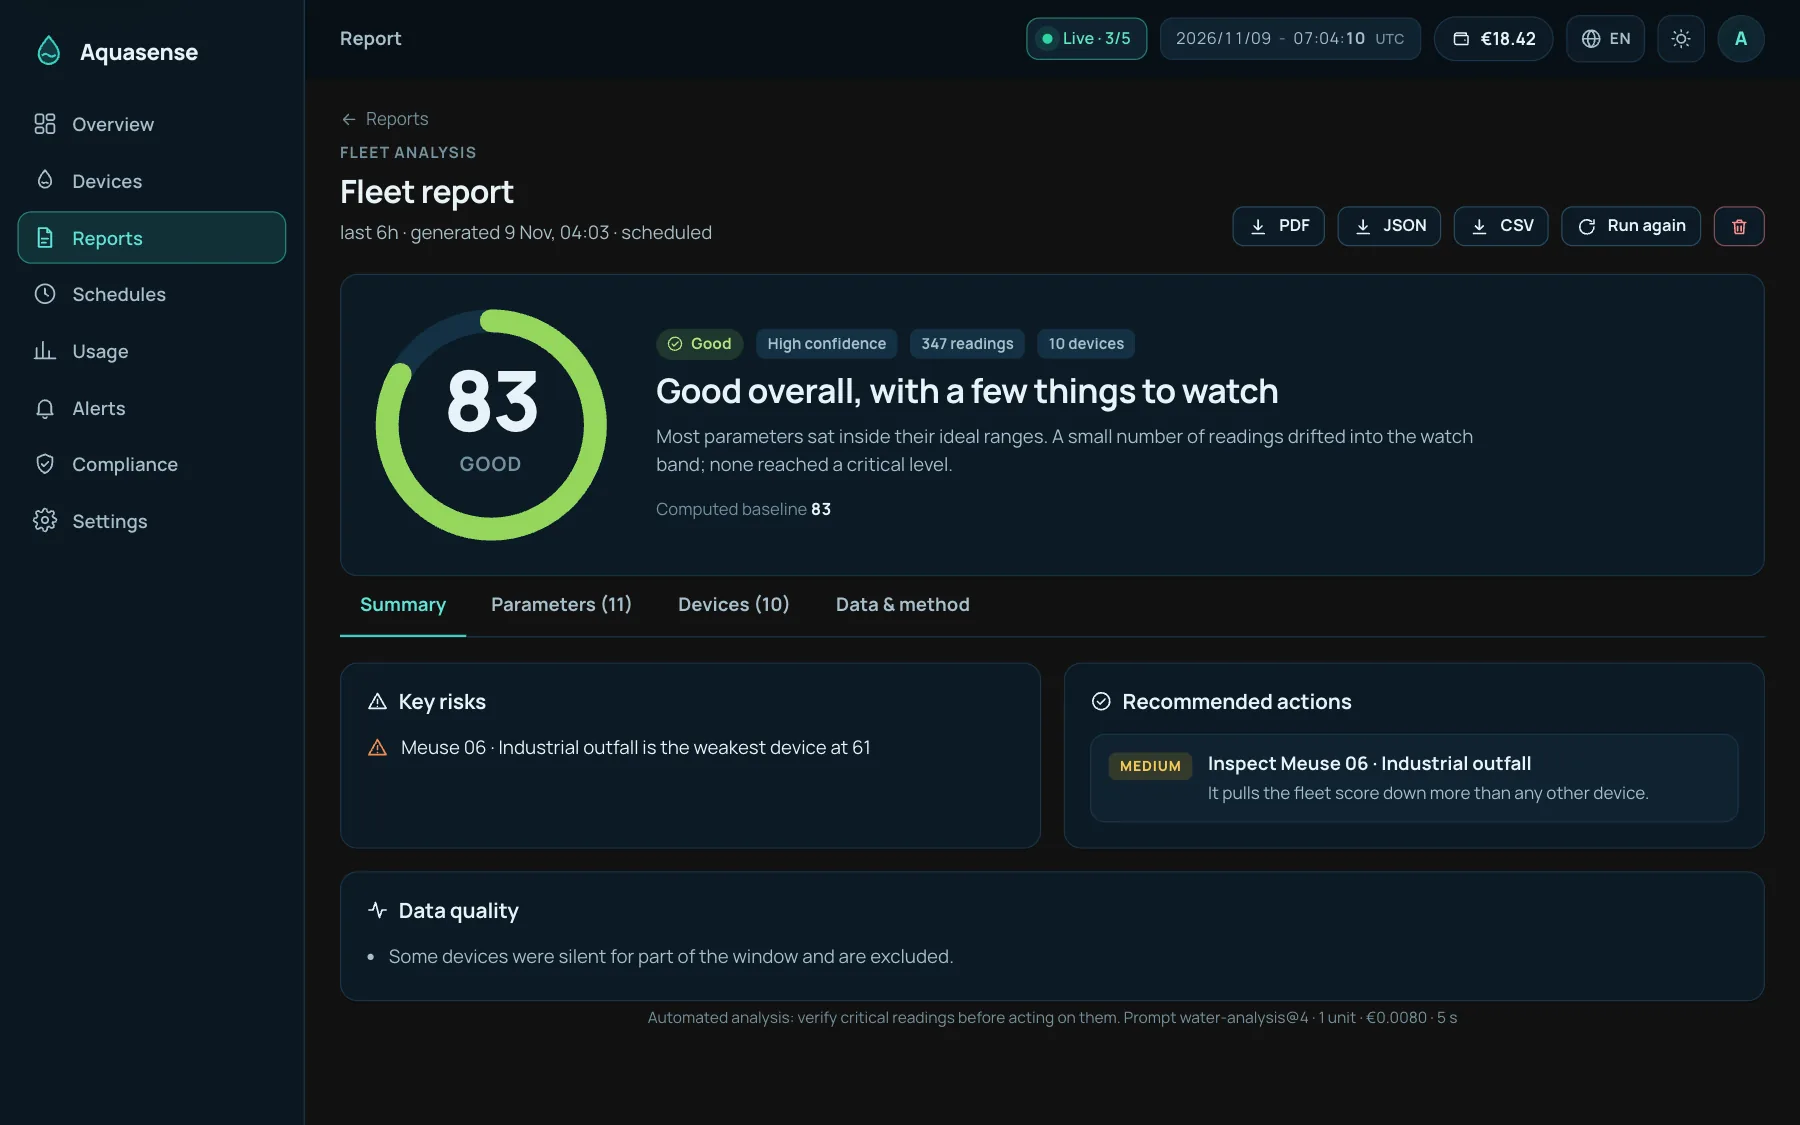
Fleet reports that point at the weak link.

Run an analysis across every device. It ranks the weakest, rolls each parameter up across the fleet and lists the actions that matter most, most urgent first.

A fleet report with a score, key risks and recommended actionsA fleet report with a score, key risks and recommended actions

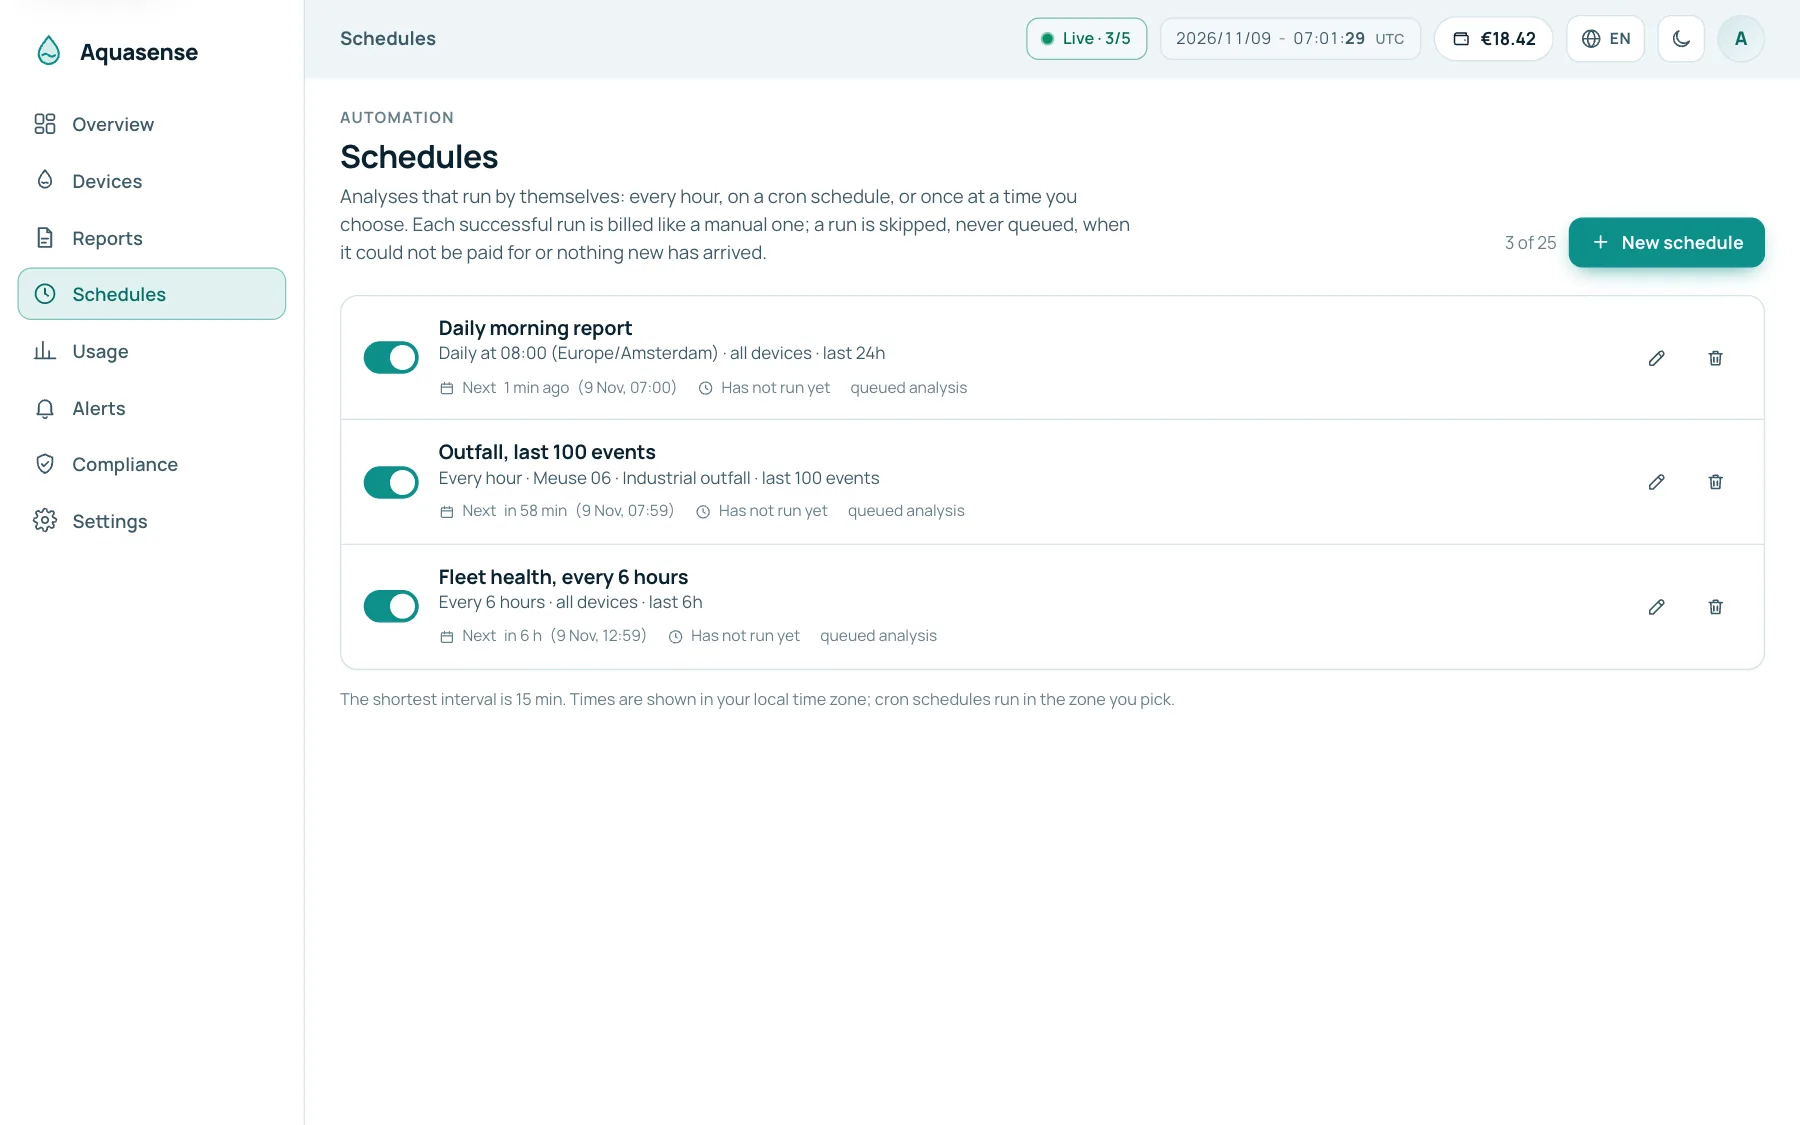
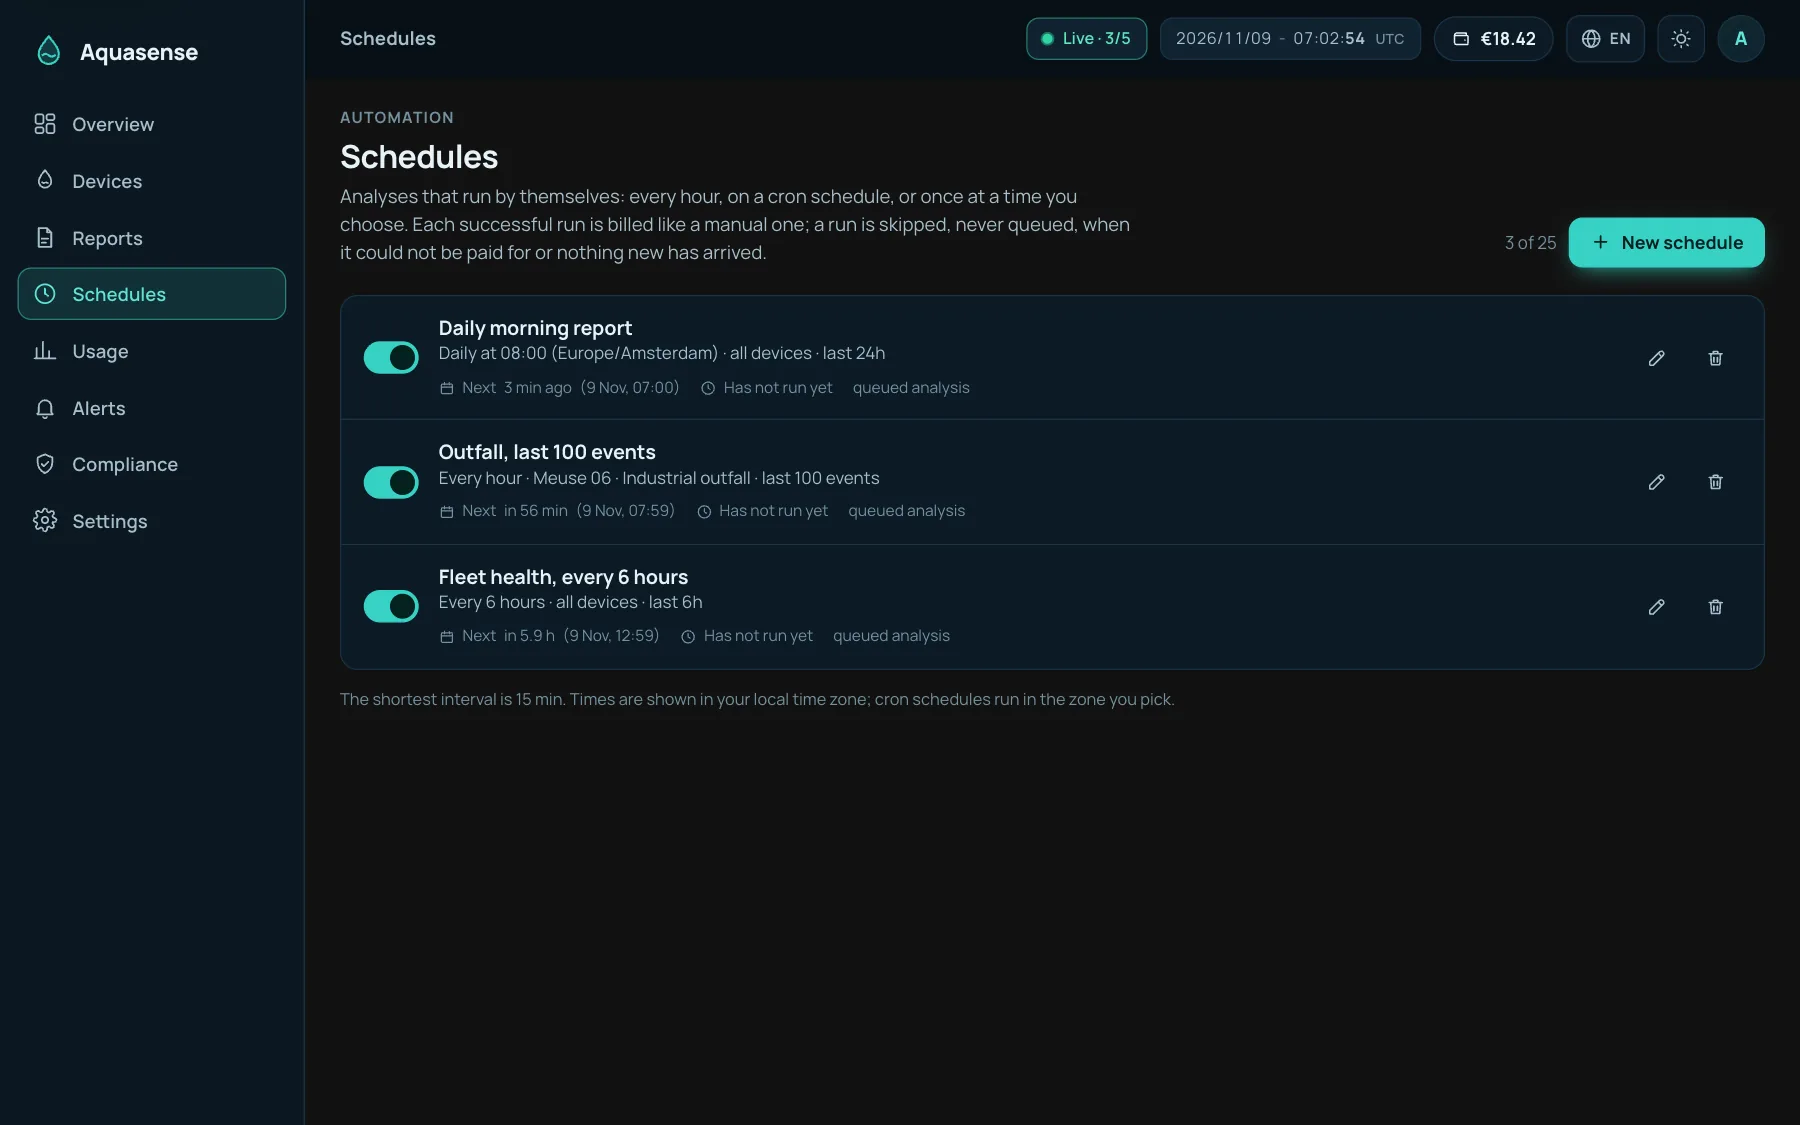
Schedules

Run analyses every hour, every day at 08:00, or once. A run that cannot be paid for is skipped, never queued.

Scheduled analysesScheduled analyses

See the next 24 hours before they happen.

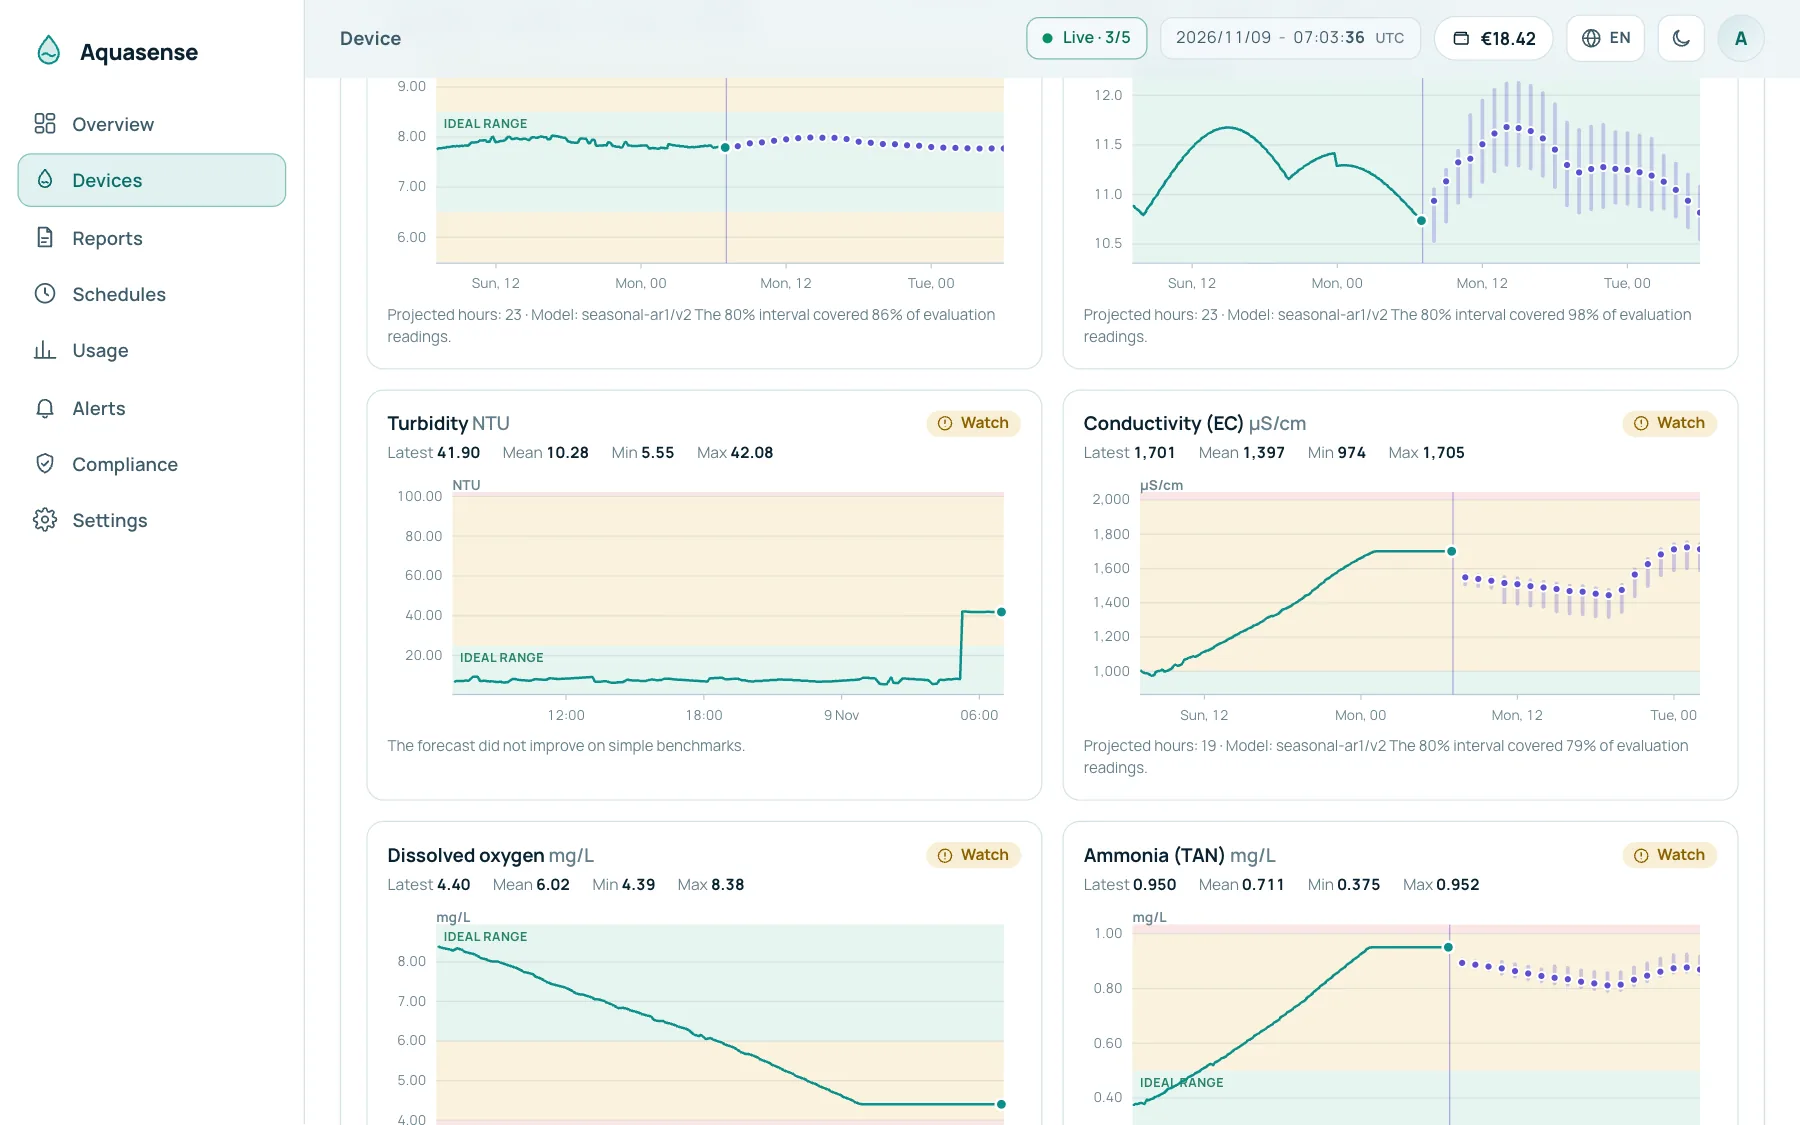
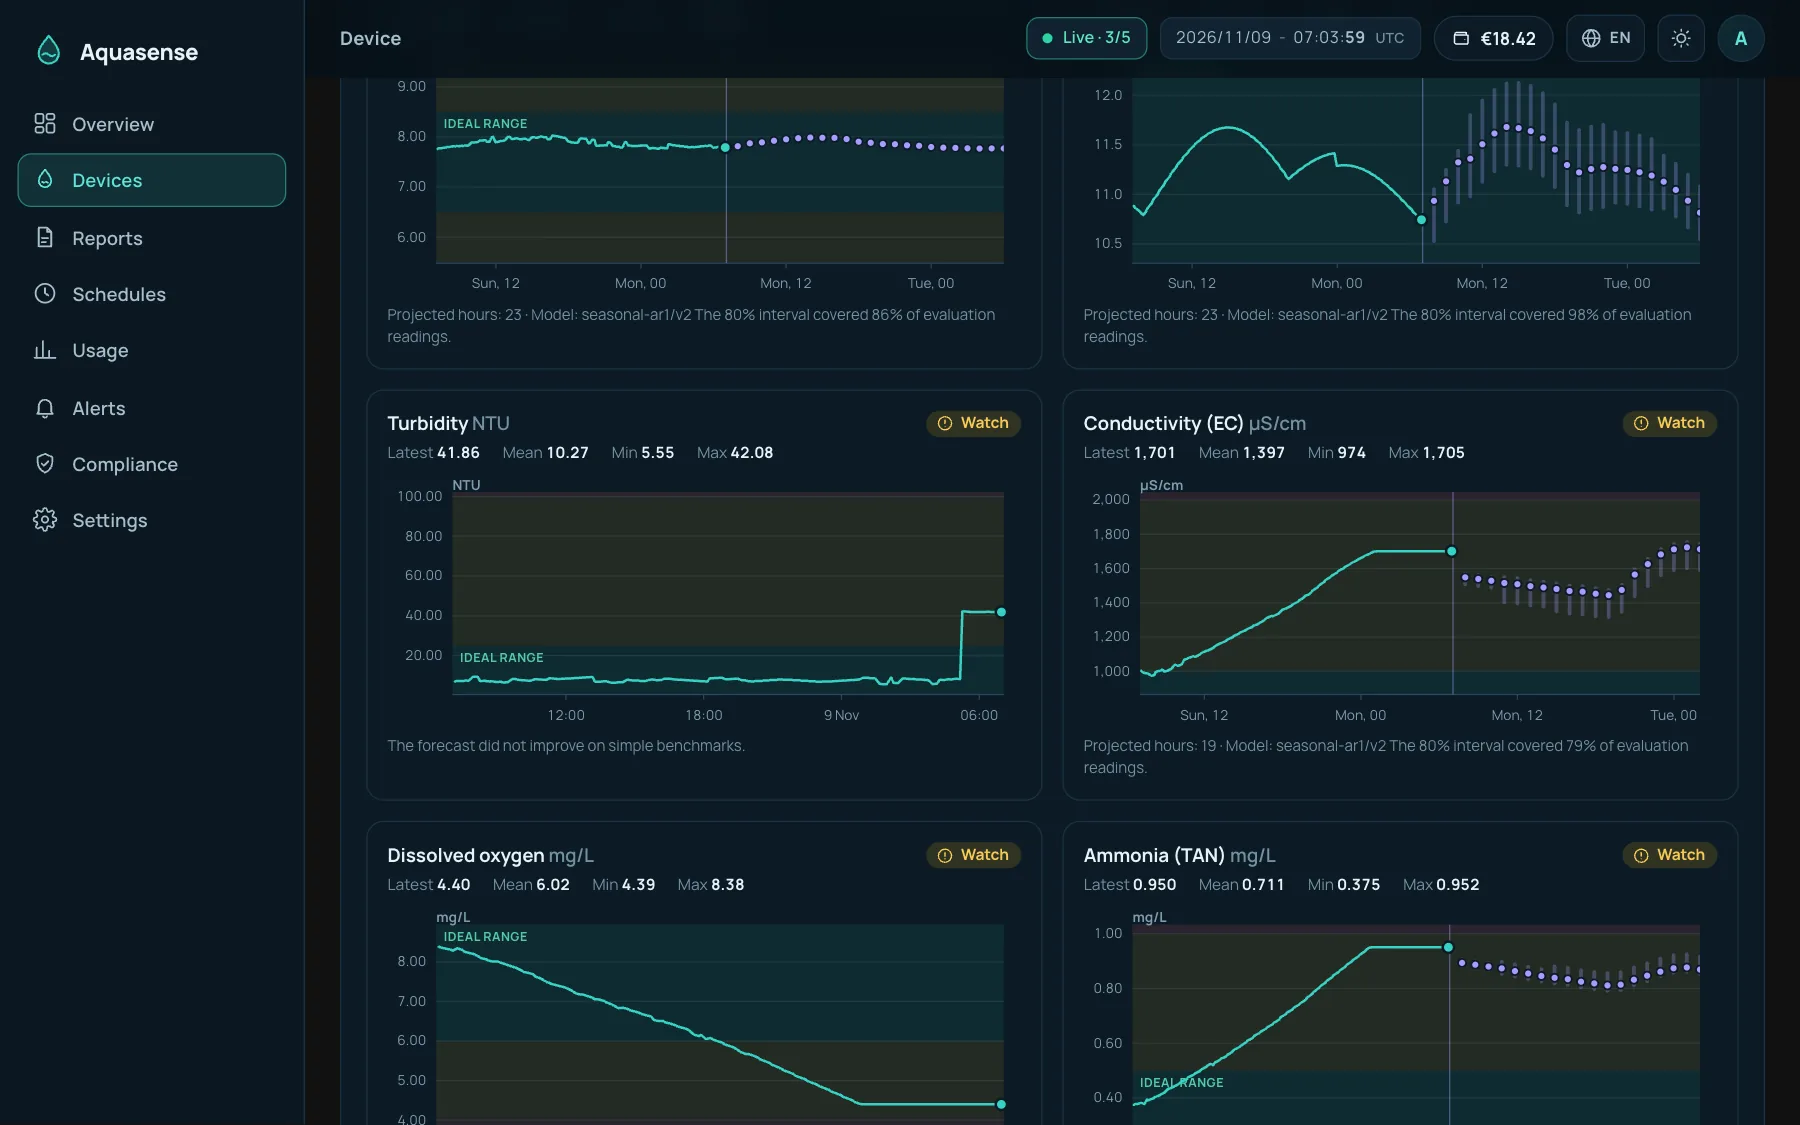
Every chart can project each parameter a day ahead, with an 80% range. It is tested against what the sensor really did, and only shown when it beats a naive guess. No model call, no charge.

Charts with a dashed projection and an 80% range for the next 24 hoursCharts with a dashed projection and an 80% range for the next 24 hours

What moves together, and what is off pattern.

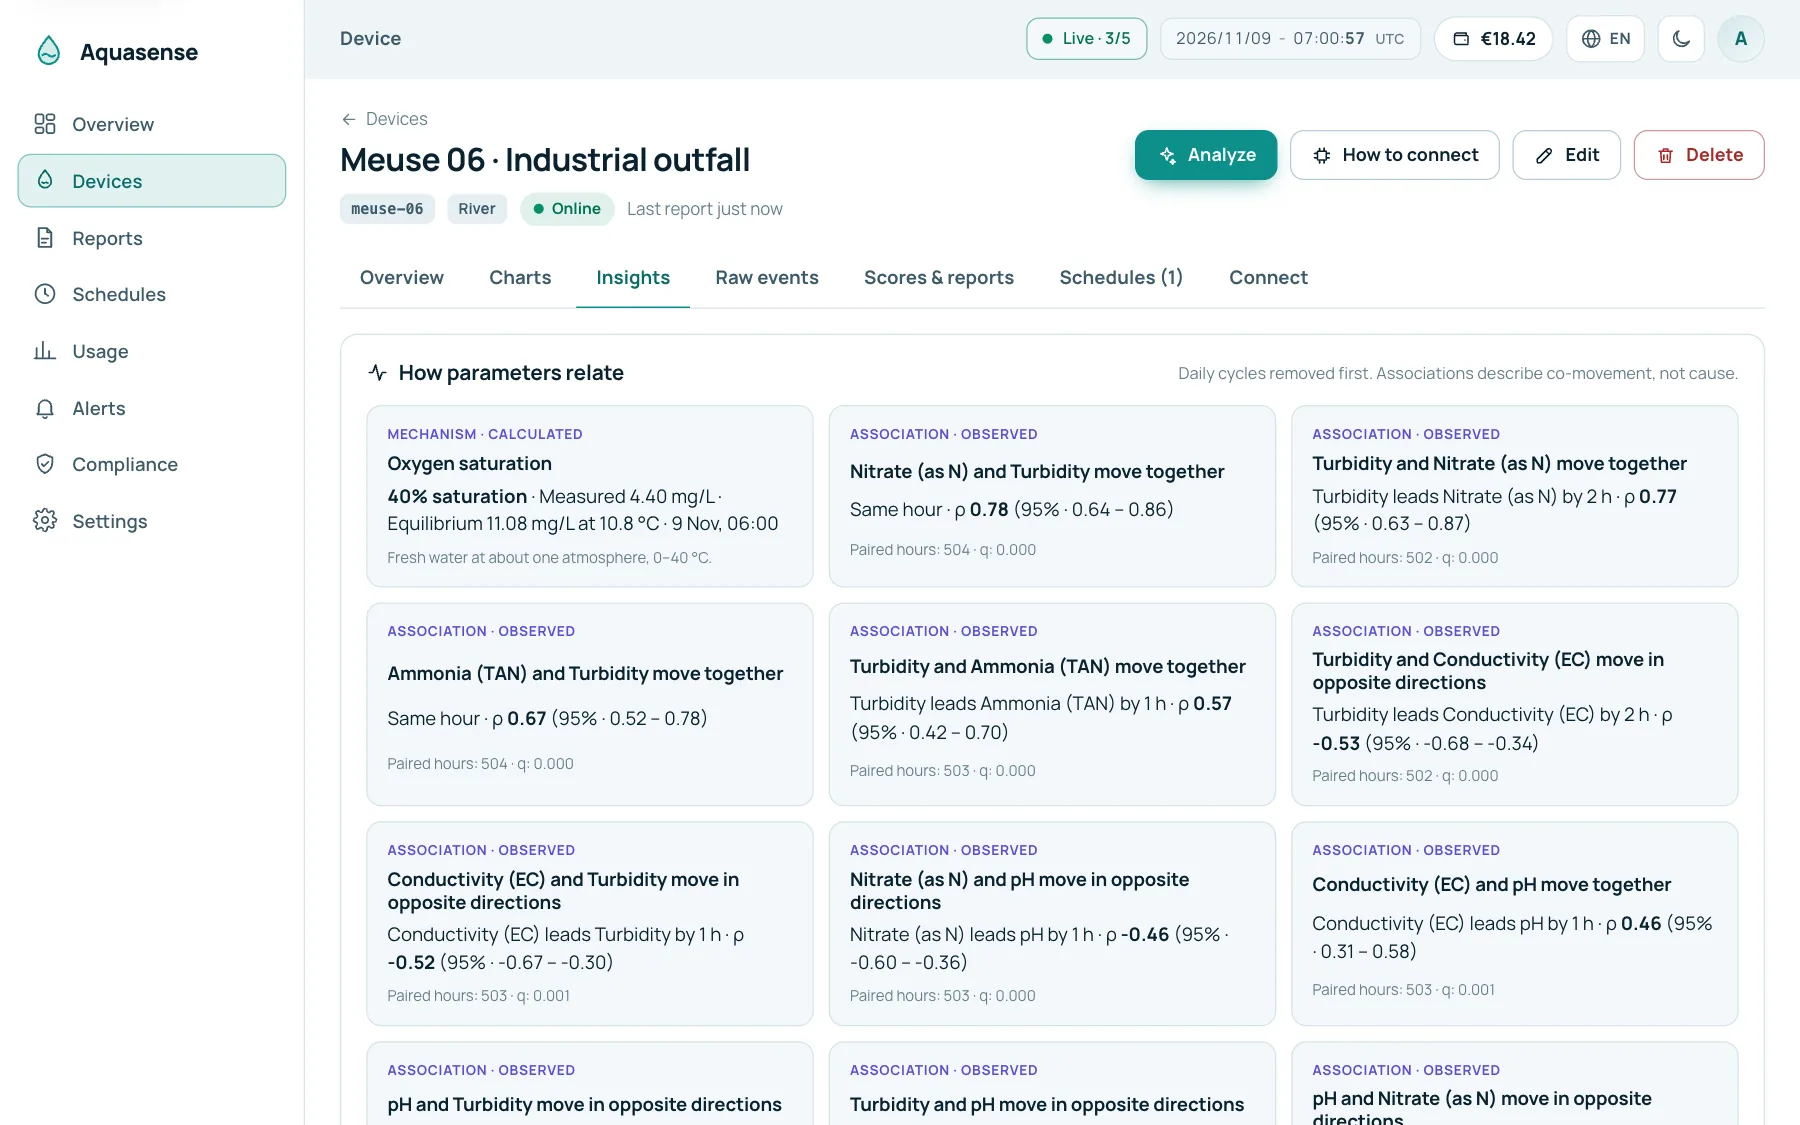
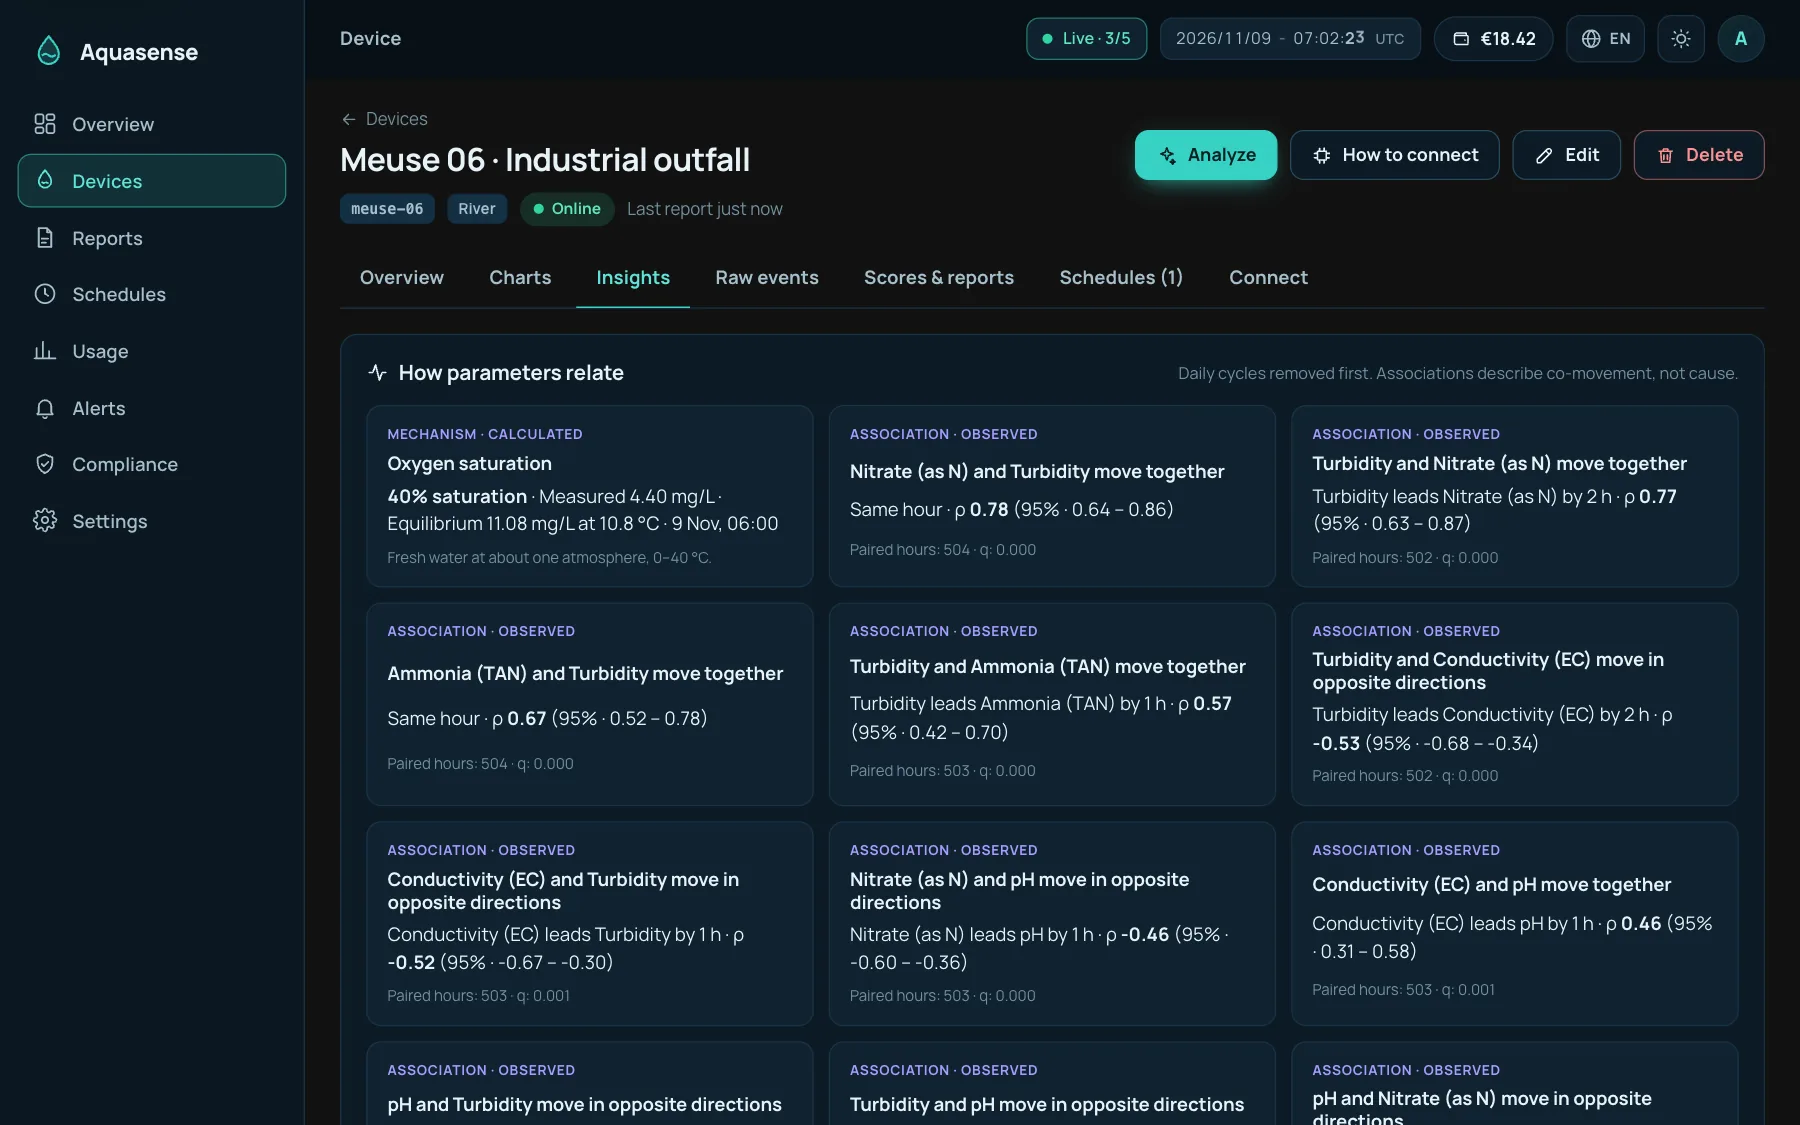
Insights shows which parameters follow each other and how many hours later, with the daily cycle removed. A shadow detector flags readings that break from the usual pattern, and says so plainly when it is only watching.

Relationship cards and shadow incidents for one deviceRelationship cards and shadow incidents for one device

Sites: cover one sensor, a whole site, or every sensor.

Group sensors into sites such as a plant, a river reach or a building. When you set up an alert rule, a compliance report or a maintenance window, choose what it covers: a single sensor, one or more sites, or all sensors. A site includes sensors you add later, and can have its own recipients.

  • Maintenance on one site silences only that site.
  • Site recipients get the alerts for their own reach.
  • Sensors and sites can be mixed in one rule.

Teams and roles

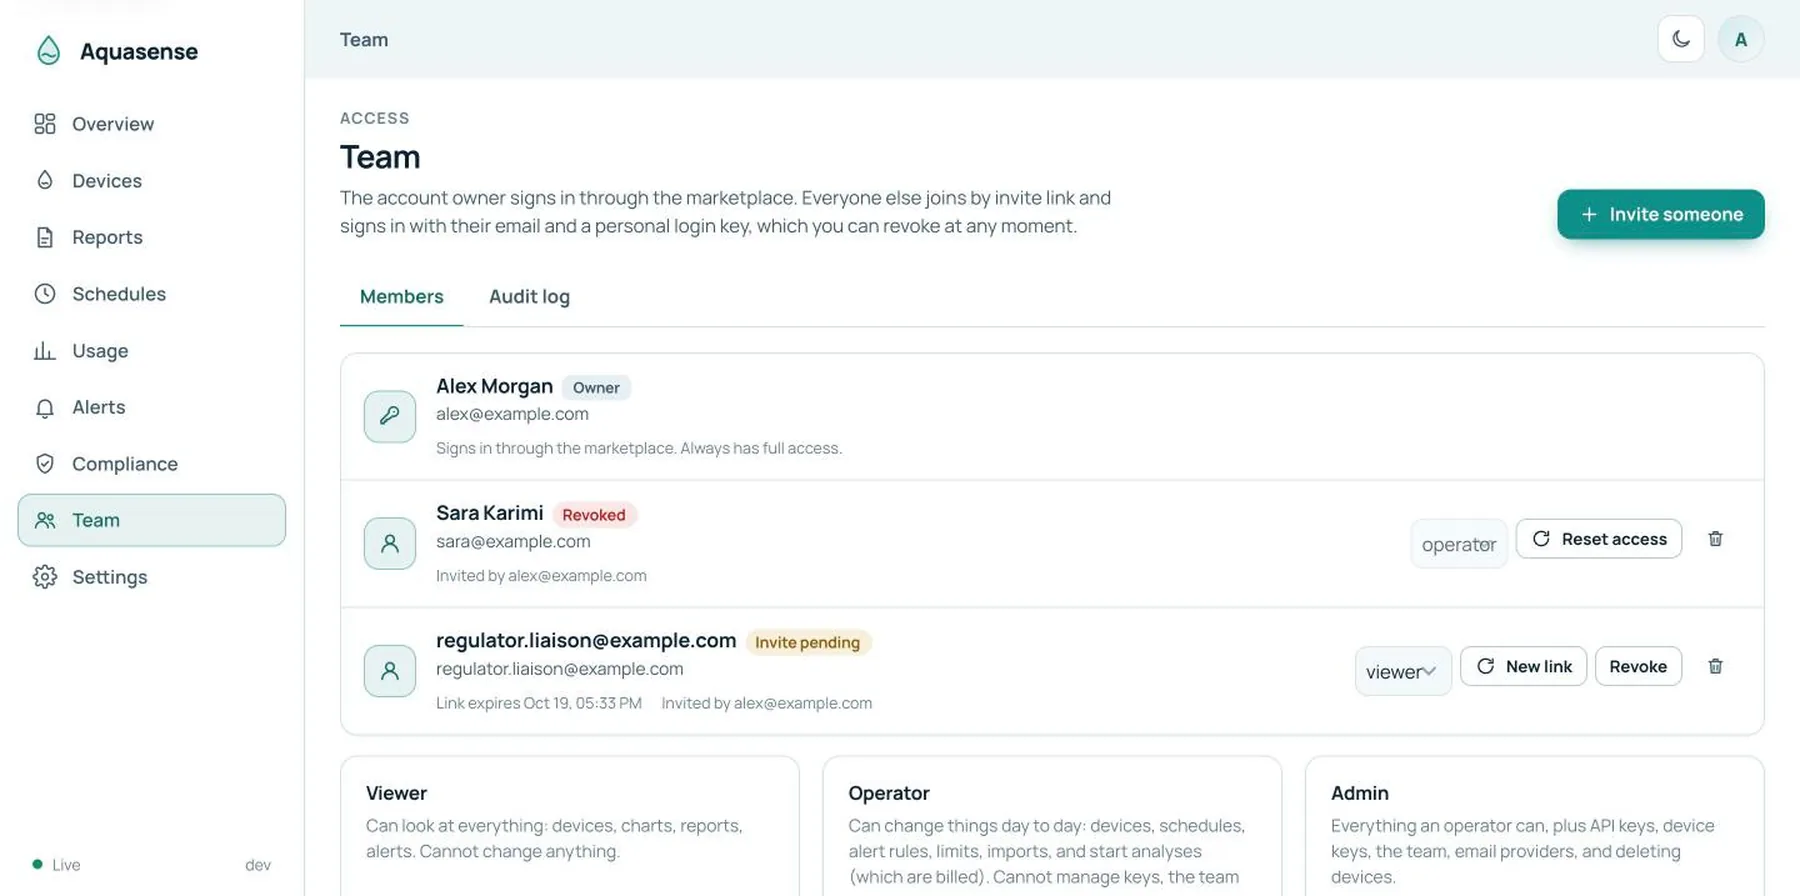
Invite colleagues as viewer, operator or admin. Billing stays with admins. Everything is audited.

Team members and roles

Raw events

See exactly what each device sent, when it arrived and how late. Debug a sensor without leaving the page.

Raw events tableRaw events table

Bring your history

Drop in a CSV or JSON file of lab results or past readings. Headers are matched for you, units are checked, nothing is silently converted.

device_id,name,profile,lat,lng,timestamp,ph,… meuse-01,Meuse at Venlo,river,51.29,6.07,2026-10-03 09:00,7.4,…
Water profiles

The same number means different things in different water.

A river can be cloudy after rain and still healthy. A lake is judged hard on nutrients and algae. A canal is slow, urban and tolerated further out. Pick the profile and Aquasense judges, scores and explains accordingly.

River

River

Flowing water that follows rain, inflow, season and snowmelt. A turbidity spike after a storm is the river behaving; a steady trend is the signal.

Dissolved oxygen≥ 6 mg/L
Turbidity≤ 25 NTU
Ammonia≤ 0.5 mg/L
Lake

Lake

Standing water that is slow to change and can stratify. In warm, still weather algae drive pH and oxygen up by day and down at night, so nutrients and chlorophyll are watched closely.

Chlorophyll-a≤ 10 µg/L
Phosphate≤ 0.1 mg/L
Ammonia≤ 0.3 mg/L
Canal

Canal

A slow, man-made channel with little flushing, shaped by urban runoff, boat traffic and sewer overflow. Looser on cloudiness, still strict on oxygen and ammonia.

Turbidity≤ 40 NTU
BOD₅≤ 6 mg/L
Dissolved oxygen≥ 5 mg/L
Drinking waterSwimming pool / spaAquacultureMarine aquacultureIrrigationWastewater dischargeIndustrial process water
Connect

Your first reading in a minute.

One JSON document, any transport. Aquasense validates every sample on its own, so one bad probe reading does not throw away the rest of a batch.

1

Create a device keyIn the dashboard, on the device's Connect tab. The key is also the MQTT password.

2

Send a readingMQTT topic aquasense/v1/{device}/readings or POST /api/v1/ingest. Browsers and proxies can use MQTT over WebSocket.

3

Watch it appearLive state, charts and the map update as it arrives. Looking at your data is always free.

publish.sh
Why you can trust the numbers

AI explains. Arithmetic decides.

A tool whose whole output is "trust the model" is not worth paying for. Aquasense is built so that you can check it.

The model never sees raw readings

Readings are aggregated in code. The model gets a few thousand tokens of statistics, ranges and trends.

Scores are computed first

Every parameter gets a baseline score from its reference range. The model may move one by a small, fixed amount, for a reason in the data.

final = clamp(model, baseline ± 15)

Every claim quotes a number

Causes are possibilities, never findings. Critical drinking-water readings are never called safe until verified.

Your data stays yours

Every query is scoped to your account. Keys are stored hashed. Model calls are made without storage, and retention is enforced.

Pricing

Pay as you go, in millionths of a euro.

One unit costs €0.000001. Everything is counted in units, so a small pond and a national network pay in proportion to what they use.

Aquasense Pay As You Go
500,000 units free

Then €0.000001 per unit, from a prepaid wallet. No monthly minimum, no seats.

  • AI analyses are priced by how much the model reads and writes, with a floor and a ceiling.
  • Alerts, schedule triggers and compliance reports cost a fixed number of units.
  • Live state, charts, the map and presence are free.
  • You pay only when the work succeeds. A failed or refused analysis costs nothing.

Estimate a month

€0per month

An estimate at current default rates, before the free units. The Marketplace listing is the source of truth for the plan and prices.

Enterprise

Run it on your own infrastructure.

For utilities, plants and operators whose water data cannot leave the site. We deploy Aquasense on-premises, look after it, and run a dedicated AI model locally, so nothing is sent to a third party.

On-premises service

Installed and configured in your data centre or private cloud. Readings, history and reports stay inside your network.

A dedicated local AI model

A model dedicated to water quality that runs on your hardware, with confidence above 80%. The scores are still computed first, so you can check every verdict.

Customer support

A named team that knows your deployment, for setup, onboarding, integrations with your sensors and day-to-day questions.

Maintenance and updates

We keep the platform, the reference ranges and the model up to date, and plan upgrades with you ahead of time.

Questions

Good to know.

Do I need special hardware?

No. Anything that can send a small JSON document over MQTT or HTTPS works, and LoRaWAN uplinks from The Things Stack or ChirpStack can be forwarded with a webhook. You can also start with a CSV or JSON file of past readings.

Which parameters are supported?

Twenty-five, including pH, temperature, turbidity, conductivity, dissolved oxygen, ORP, chlorine (free, total and dioxide), ammonia, nitrate, nitrite, hardness, COD, BOD, TOC, TSS, phosphate, ozone, UV absorbance, iron, chlorophyll-a, blue-green algae and salinity. A device sends only what it measures.

What does the AI actually see?

Aggregates: counts, ranges, trends, the share of readings in each zone, a handful of time buckets and the baseline scores that were already computed. Never raw readings. If a device has a location, a rounded position (about 1 km) can be shared so the report can comment on its surroundings; that can be switched off.

Can the AI be wrong?

Yes, which is why the arithmetic is separate. Scores start from a computed baseline and the model can only move them by a fixed, small amount. Reports say to verify critical readings with a calibrated meter or a lab test before acting, and never claim a regulatory violation.

How long is my data kept?

Readings are kept for 90 days by default, analysed score history for 400 days and stored reports for 90 days. Model calls are made without storage on the provider's side.

Who can see what?

The account owner signs in through the Marketplace. Team members join by invite link as viewer, operator or admin. Viewers can look but not change, operators run the day to day, and billing is visible to admins and the owner only.

How is it billed?

From your prepaid Sensifai wallet, in units of €0.000001, after the work succeeds. The first 500,000 units are free. The Billing page in the dashboard shows the rate card, your usage and a calculator.
Ready when your water is

Know your water before it tells you.

Start free, connect one device, and see your first score in minutes.

Go to platform